/filters:quality(90)/fit-in/970x750/coros-web-faq/upload/images/4e5e85cc6737e5007f12494b73a6eed5.jpg)
What Are Running Dynamics?
Running dynamics are motion-based metrics that track your stride mechanics in real time. They include measurements like ground contact time, stride height, symmetry, and more. These metrics show you how you're running, rather than just pace and distance.
Use them to monitor efficiency, identify fatigue patterns, guide form adjustments, and track progress over time.
Ground Contact Time
What it measures: The time (in milliseconds) your foot stays on the ground with each step.
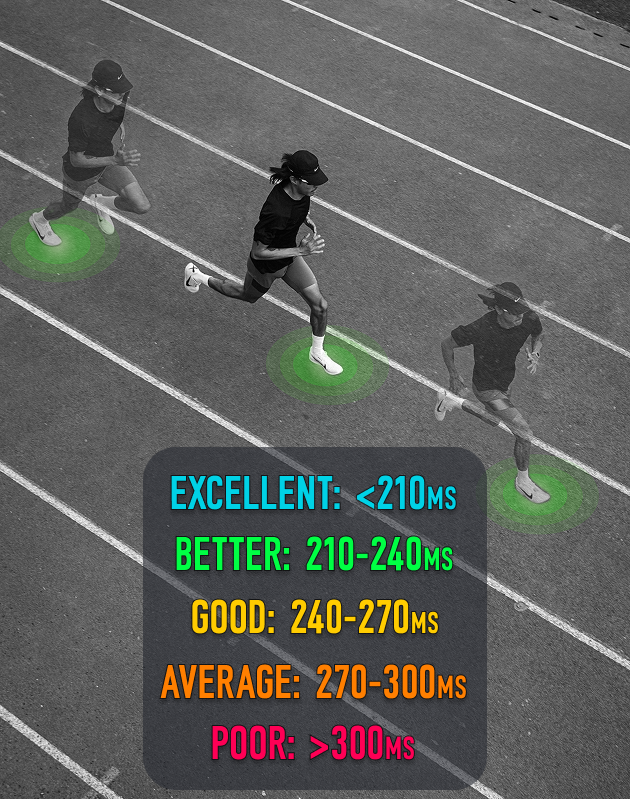
Use this to assess running economy and fatigue. Shorter ground time usually indicates better leg stiffness and reactivity, both of which are signs of efficient running. Watch how this changes with pace, fatigue, or terrain. Rising ground times late in long runs or hard intervals may show form breakdown.
Left/Right Balance
What it measures: The percentage of ground contact time spent on each foot.
| Benchmark | Range |
| Significant Imbalance | >R 51.5 |
| Slight Imbalance | R 50.6–51.5 |
| Ideal | R 50.5 – L 50.5 |
| Slight Imbalance | L 50.6–51.5 |
| Significant Imbalance | >L 51.5 |
Imbalances can indicate asymmetries, past injuries, or strength deficits. Monitor this metric across runs, not just in isolation. Occasional drift is normal on trails or tracks, but consistent imbalances over 51.5% may raise injury risk. If persistent imbalance appears, consider adding more unilateral strength work like split squats. Strengthening each side separately forces both sides to grow, rather than one side taking the brunt of the weight and causing an imbalance.
Stride Height
What it measures: Vertical bounce with each stride, in centimeters or inches.
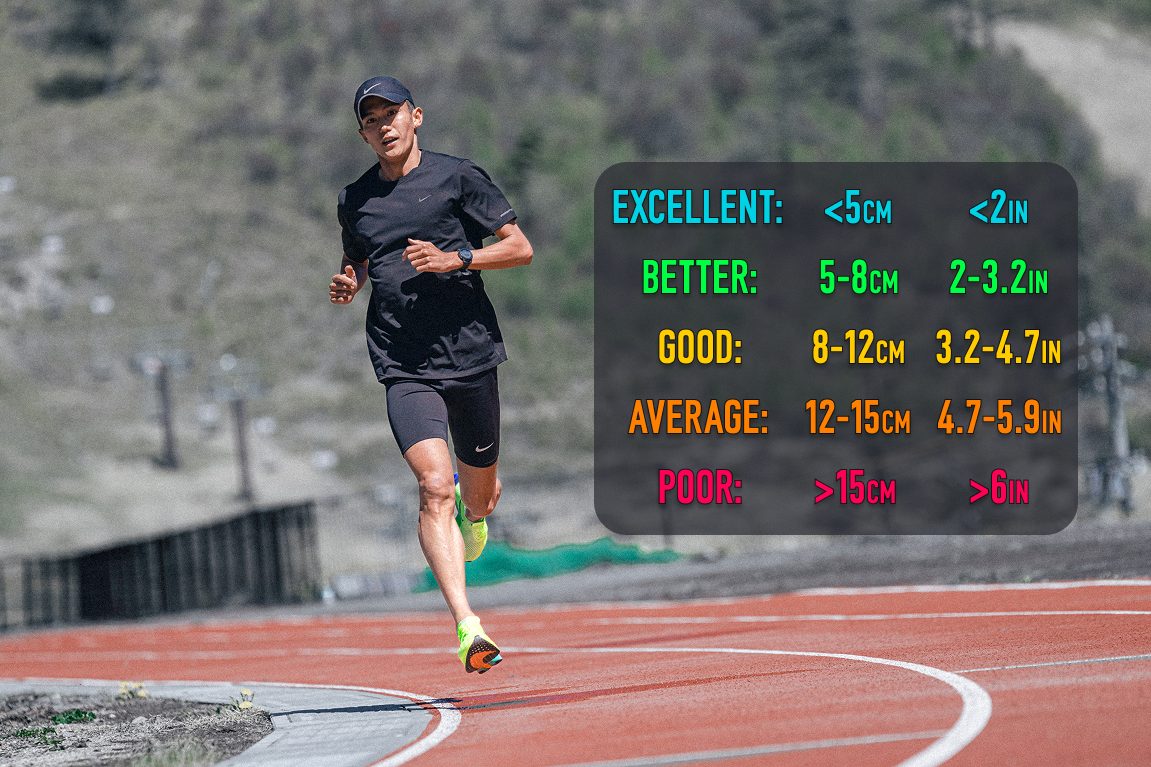
More bounce means more energy is directed upwards, not forward. Lower values indicate more efficient motion. A sudden increase in stride height during a run may signal fatigue. Compare across efforts to monitor consistency.
Stride Length
What it measures: The distance from one footfall to the next, measured heel to heel.
| Typical Range | |
| Walking | ~65 cm (2.13 ft) |
| Running | 90–150 cm (2.95–4.92 ft) |
Stride Length × Cadence = Speed. For a runner to increase in speed, either stride length or cadence must increase. However, efficient runners find a stride that fits their mechanics, and let the increase in length come naturally as they accelerate. Some runners mistakenly try to intentionally lengthen their stride to run faster, which leads to overstriding and increased injury risk.
COROS Tip: To prevent overstriding, the Running Form Test provides insight on your Strike Angle, the location of your foot compared to your center of mass when touching the ground. Higher strike angles are typically associated with overstriding and related injuries.
Stride Ratio
What it measures: The ratio of stride height to stride length, shown as a percentage.
| Benchmark | Range |
| Excellent | <6% |
| Better | 6–8% |
| Good | 8–10% |
| Average | 10–12% |
| Poor | >12% |
Stride Ratio is a direct indicator of running efficiency. Lower ratios mean more energy is directed forward rather than wasted vertically. Watch how stride ratio shifts during progressive or long runs. If it trends upward while pace holds steady, it shows that you are spending more energy to keep the same pace. When that happens, fatigue is soon to follow.
Wrist-Based vs POD 2 Metrics
COROS watches with wrist-based motion sensors provide access to running dynamics during outdoor runs. These are a strong option for everyday training, especially for road runners looking to monitor trends. To view any of these metrics in real-time during your runs, you can customize your data pages on the COROS App.

For the most accurate data, the COROS POD 2 remains the best choice. It tracks movement from your foot or waistband and adapts to treadmill use and GPS limitations. It’s also required for accessing the Running Form Test.
The Running Form Test is a 5-minute assessment that will provide detailed feedback on these metrics and more. After completing the test, be sure to check out our guide to improving your score, which will help you fix any weaknesses identified by the test.